GolangNote

Golang笔记

使用Profiling 分析Go 程序的瓶颈

Permalink

Golang 使用 Profiling 来分析程序的瓶颈的方法很简单。

引入后在main 里添加一行

Go: profile
1
2
3
4
5
6
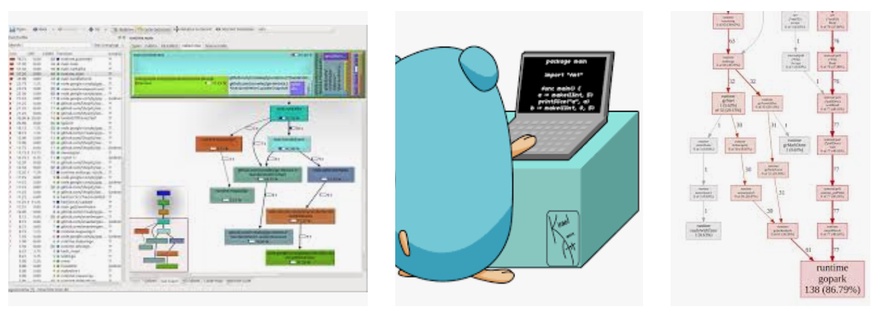
import "github.com/davecheney/profile"

func main() {
    defer profile.Start(profile.CPUProfile).Stop()
    ...
}

首先运行 go build ,然后跑程序,程序开始时会有提示:

Bash: profile
1
profile: cpu profiling enabled, /tmp/profile488201610/cpu.pprof

程序终止后查看结果:

Bash: pprof
1
go tool pprof -raw /tmp/profile488201610/cpu.pprof

项目 https://github.com/davecheney/profile

本文网址: https://golangnote.com/topic/98.html 转摘请注明来源

Related articles

Go 1.5.1 更新的功能

Go 1.5.1版本对编译器,汇编器, fmt, net/textproto, net/http, 和 runtime 包的 bug 修复。...

vuego: 用GO编写 vue.js 前端

vuego 是一个基于WASM 对Vue.js 的封装,使用Web Assembly 编译。可以让开发者用go 来写Vue.js 前端脚本。...

Go 编程格言谚语

这些 go 格言谚语大多出自 Rob Pike 振奋人心的演讲视频,有很大参考价值。...

Write a Comment to "使用Profiling 分析Go 程序的瓶颈"

Submit Comment Login
Based on Golang + fastHTTP + sdb | go1.22.3 Processed in 0ms